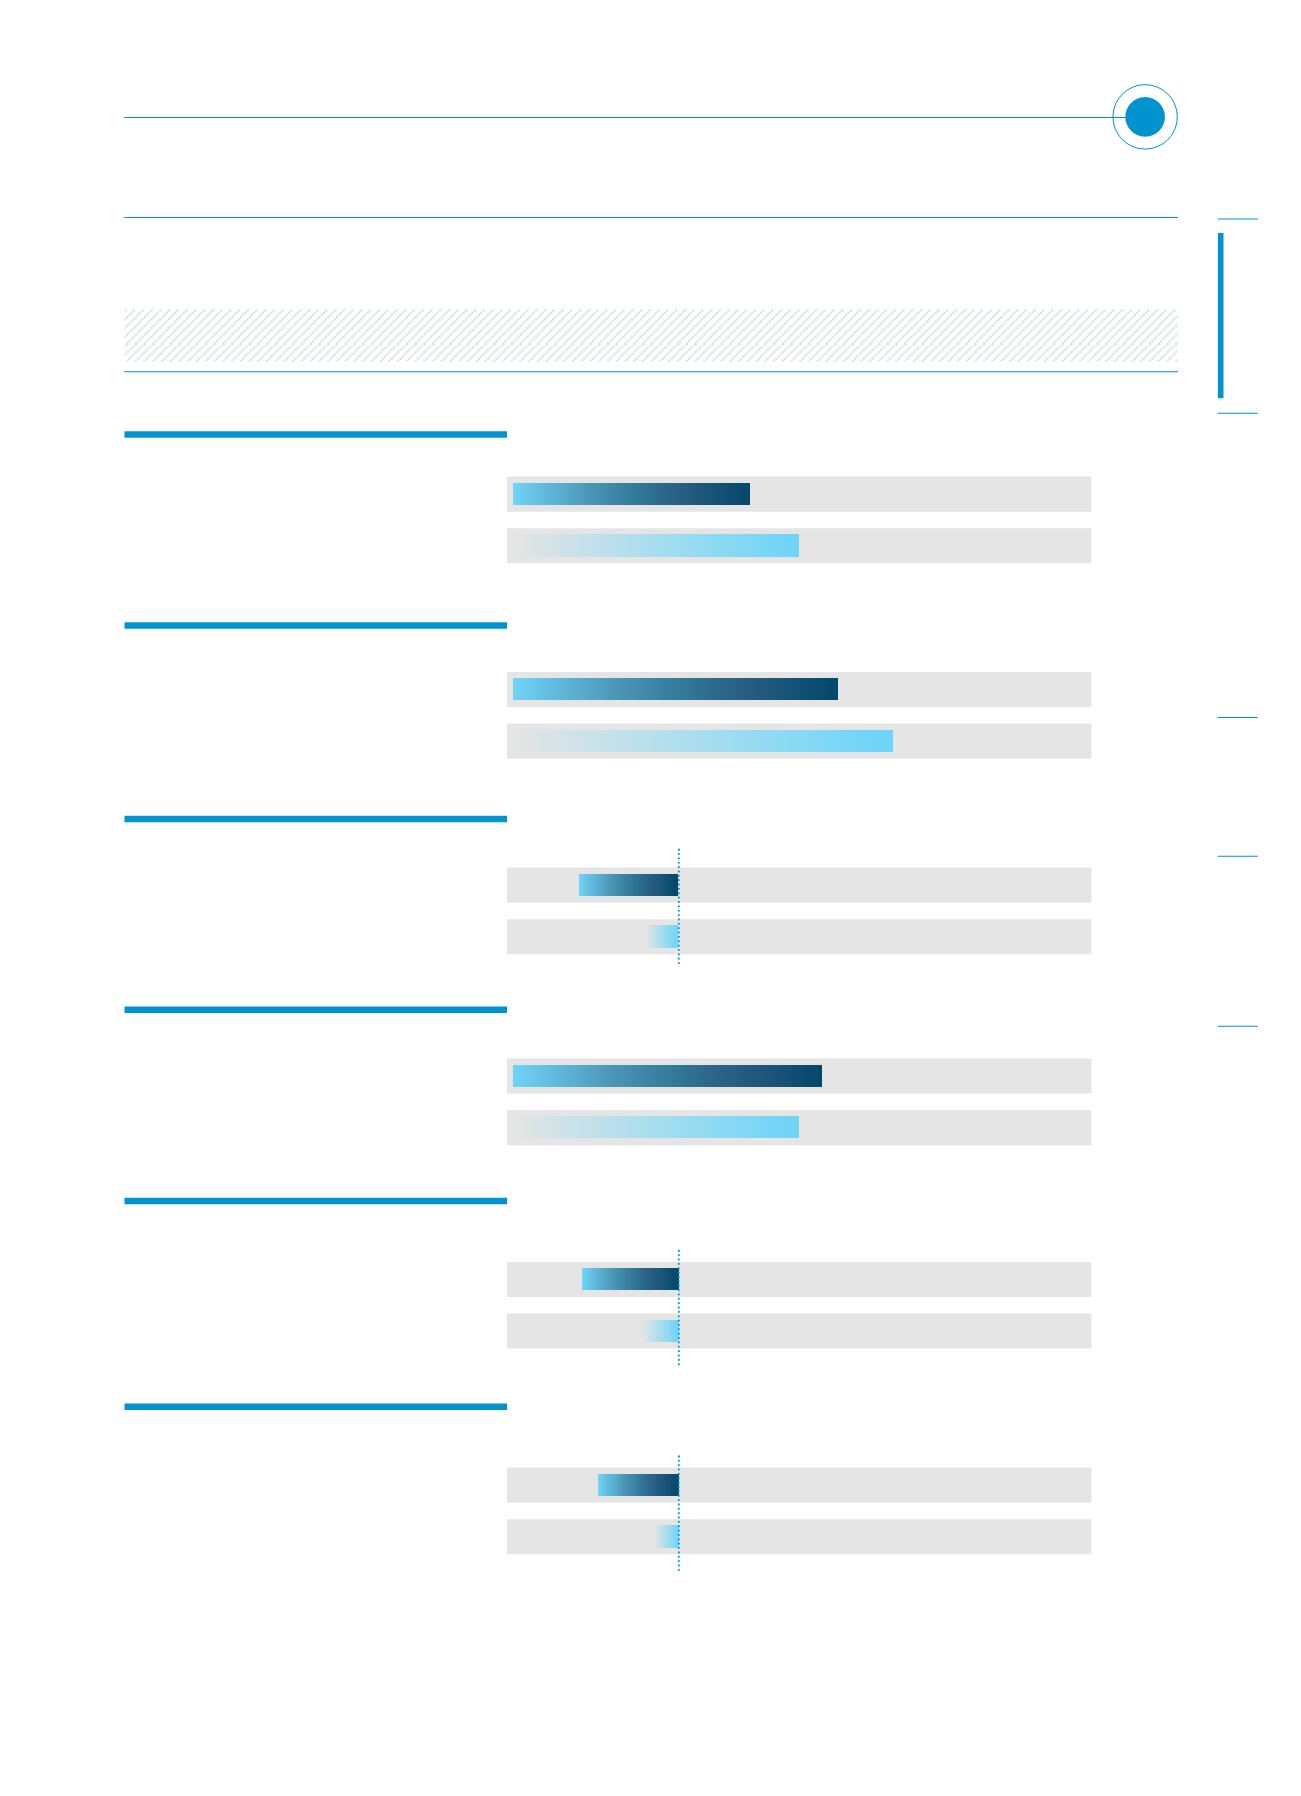

REVENUE ($’M)
GROSS PROFIT ($’M)
NET LOSS BEFORE INCOME TAX
($’M)
GROSS PROFIT MARGIN (%)
NET LOSS ($’M)
ROE (%)
2016
2016
2016
2016
2016
2016
204.0
41.8
(14.9)
20.5
(15.7)
(9.4)
2015
2015
2015
2015
2015
2015
269.5
49.7
(1.8)
18.4
(5.2)
(2.9)
DYNA-MAC HOLDINGS LTD.
2016 ANNUAL REPORT
05
Performance At A Glance
Financial Report
Corporate Governance and Transparency
Sustainable Growth
GROUP FINANCIAL
HIGHLIGHTS
Year in Review


